


In an era where data reigns supreme and dictates decisions from boardrooms to living rooms, understanding how to present your data has never been more crucial. Data, after all, holds the power to inform, convince, or even change minds. However, wielding this power requires more than just a bunch of numbers on a spreadsheet; it requires the right presentation.
In essence, data presentation is the act of transforming raw, number-heavy data into a visual context that’s easy to understand, digest, and act on. Understanding and embracing this art allows data to tell its stories, reveal its hidden insights, and support your assertions and arguments. In this article, we explore eight efficient ways to present your data and potentially sway outcomes in your favor. Keep reading.
Embrace Visualization


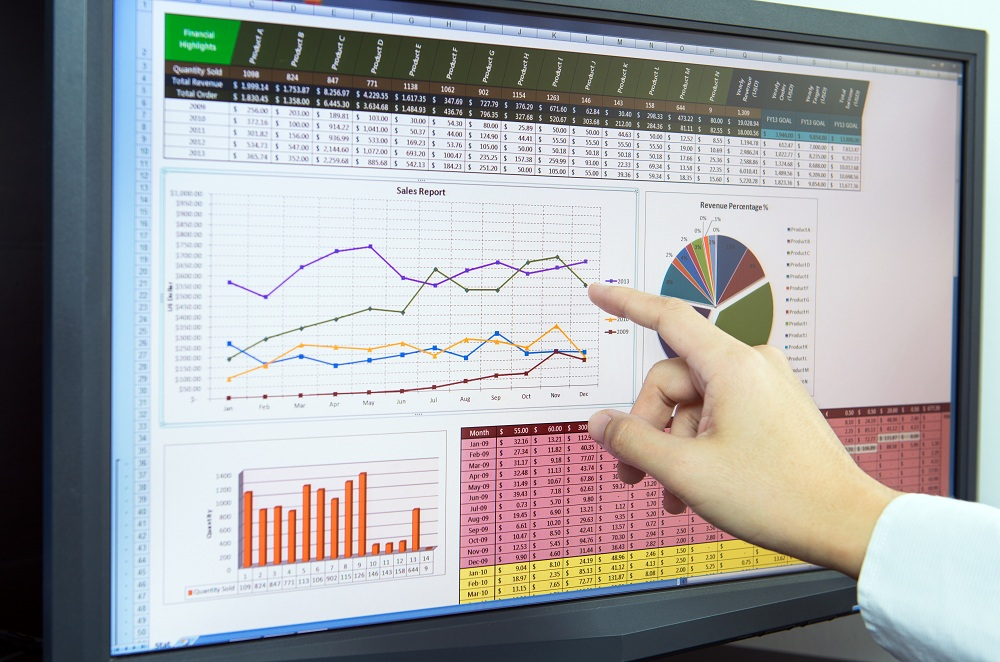
Alt Text: A computer screen displays several types of data visualizations
The human brain processes visual information far faster than text. Leveraging this natural proclivity can increase the comprehension of your data. It’s not enough to throw your numbers into a random chart; the type of visualization you select has an impact on the clarity of the message you’re trying to convey. For instance, a line graph would perfectly highlight trends over time, while a bar graph would excellently show comparisons among categories.
In some cases, you might want to display parts of a whole, and a column chart could be the best tool. Remember, the primary purpose of visualization is to make your data easier to understand. Therefore, choose a format that best tells the story behind the data.
Also, avoid cluttering your visualization. A clean, easy-to-read visualization is more appealing and effective in conveying a message. Beyond the type of visualization you deem appropriate, consider using color encoding to provide additional layers of information or emphasize particular points. Always aim to create a visual hierarchy where the most critical data points are the most visually dominant.
Contextualize Your Data
In the world of big data, information isolated from its context is meaningless. Remember that data is a comprehensive representation of facts, stats, or information resulting from analysis or investigation in a readable context. Providing context involves explaining situational circumstances or factors surrounding data collection and interpretation. When recipients understand the context, it helps them to acquire a clearer comprehension of what your data represents and how it connects to broader trends or issues.
One way to provide context is by making comparisons. Comparisons can help your audience to understand the scale of your data. For example, saying company ‘A’ made 5 billion dollars in sales last year might seem impressive, but it becomes more meaningful when compared with previous years or another company. Presenting data against key performance indicators can also help provide context.
Another way to contextualize data is by providing annotations on your charts or graphs. Annotations help to clarify what certain data points represent, making it easier for your audience to understand your data at a glance. Be cautious, though, and avoid overdoing it, as too many annotations could make your visual cluttered and confusing.
Prioritize Accuracy and Precision
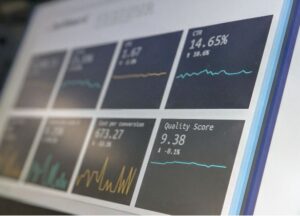

Alt Text: An image shows data based on precise and accurate information
Data accuracy is fundamental for credibility. Accuracy includes truthful representation of data, disclosing the sources of your data, and ensuring your data is up-to-date. Inaccurate data can lead to incorrect assumptions, decisions, and interpretations, ultimately impacting the reliability of the presented data.
Precision, too, is crucial. Precision concerns the level of detail in your data. In general, you should provide enough precision that your audience can fully understand and analyze the data accurately, but not so much that it overwhelms them.
Avoid cherry-picking data that only supports your narrative while overlooking those that don’t. Consider displaying negative results, as well; it underscores the depth of your analysis and showcases your honesty and objectivity.
Altogether, data presentation is an essential skill in the modern world. At its core, it’s about making complex data understandable, engaging, and actionable. By embracing visualization, contextualizing your data, and ensuring accuracy and precision in your data presentation, you can become a master at presenting data.


